
Did you know? In the first quarter of 2023, Canada's population grew by 204K (Globe and Mail, Apr. 6, 2023) — by far the largest quarterly increase on record. Will increased immigration targets keep the pressure on home prices, regardless of the cooling effect of higher mortgage rates?
To shop or not to shop (for a home).
Interest rates just went up again. How will it affect home prices?
After declining for much of last year, Canadian home prices are still increasing nationally. Let's look at some numbers to see where they may go from here.

Add (a home) to cart? How to decide if the timing's right.
It's been a wild ride for housing markets in the last year — the central bank's rate-hike pause in February brought buyers back to increase demand and prices in many regions. Yet, the higher rates also discouraged sellers from listing, waiting to see what prices would do or to avoid increased mortgage payments with a move.
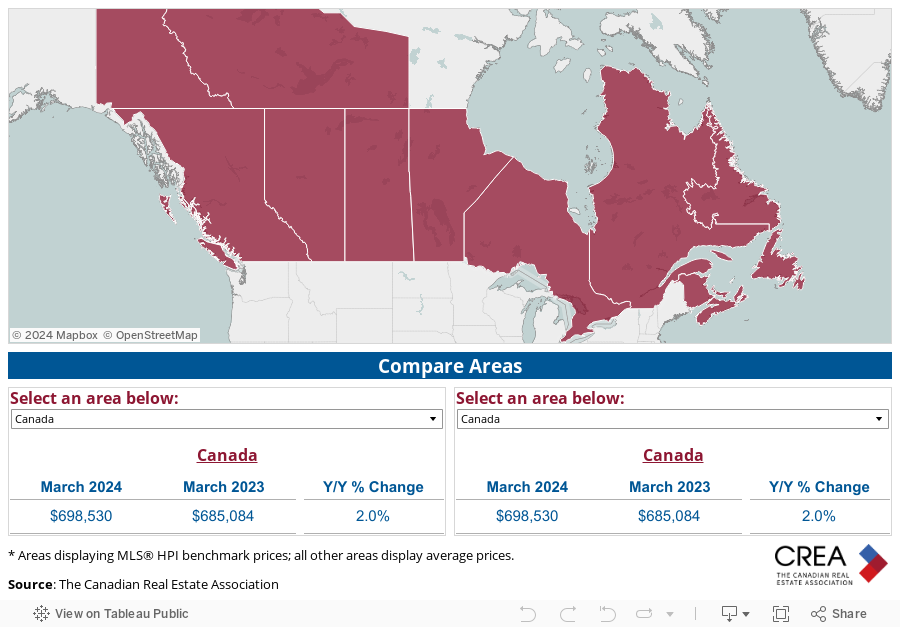
Last year, Canada hit an all-time peak for home prices in March 2022, up roughly 45% from pre-pandemic levels. Fast forward to June 2023, and average national home prices (using the MLS® Home Price Index measure) are down only 4.5% year-over-year.
June saw a national price increase of 2.0% from last month. But with the Bank of Canada resuming rate hikes this summer, markets appear to be balancing (varying with the area) — more sellers are finally listing (perhaps to get a higher sale price in now) as demand slows. According to CREA, this dynamic may serve to moderate further home price growth over the next few months.
How do Canadian home prices compare over time?
The national composite average MLS® HPI from Q2 2022 ($796,300) to Q2 2023 ($760,600) has decreased by $35,700 (-4.5%).
(Canada’s MLS® HPI Composite Benchmark Price measures the price of a 'typical' Canadian home.)
Using Q2 2023 numbers, this provincial map graphic compares home prices going back 1 year (2022), then 3 years (2020), and 5 years (2018).
Falling from the peak was inevitable. But if you compare Q2 2023 prices to 5 years ago, most provinces register substantial gains from 2018.
Hey, PEI! Prince Edward Island has seen home prices increase 82.0% from 2018. The Atlantic Provinces are the star of home value gains in the last 5 years.
These numbers show that if we take a moment to assess the housing market and home affordability, higher interest rates haven't yet made a major dent in Canadian home values measured over the long term.
Get the latest home price stats from CREA
Comparing current home prices to past years can give you a sense of how home prices are doing overall, despite fluctuations during a year. To see the latest Canadian national home price and sales numbers, visit CREA's Monthly Stats page.
Will home prices stabilize?
National home-sale activity slowed in June 2023, with a modest 1.5% increase over May. The GTA (Greater Toronto Area) saw cooling, offset by gains in over half of local markets, especially in British Columbia and Alberta.
The sellers are (sort of) back, but for how long? Listings are still considered low but have increased heading into summer to ease choice for buyers — who are still plentiful with record population growth in many centres across Canada. Plus, housing starts in May saw the largest bump-up in a decade, which may help ease future housing demand (if this trend continues).
Home price cooling on the horizon? The recent rate hikes may convince sellers to go back to the sidelines, especially if slowing sales also cool prices in the last half of 2023. And buyers may reconsider their purchase-plans to wait out the rate instability — to add more downward price pressure.
Will waiting for lower mortgage rates help you buy?
There's concern that a recession is heading our way sometime in 2024. If one does take hold or inflation comes down enough, the central bank will be forced to reduce rates at some point, maybe sometime next year.
Lower mortgage rates would help improve mortgage payment affordability and even lender qualification. However, the longer buyers wait for lower interest rates — the more may flood into the market to increase demand again. If there's a listing or housing shortage, prices could be pushed higher, negating any affordability advantages they were hoping to snag.
As well, lenders may be implementing stricter mortgage qualification requirements later this year, which could interfere with the positives of having a lower mortgage rate (for example, if the federal mortgage stress test makes it harder for you to qualify).
A (suit) case of waiting too long? Recessionary conditions (if they happen) may negatively impact salaries and job security to reduce home affordability, despite the potential for lower mortgage rates. But if you feel that you can't afford a home until rates drop, you can still plan (with us!) and be ready to shop when the time is right.
Where are mortgage rates headed? Read our 2023 Mortgage Rate Forecast to get the lowdown on what's happening in the economy and when the rate cuts might start.
Time to shop the (home) aisles? Our experts can help you decide.
Fall is typically a slower time in the Canadian housing market. Back to normal schedules after the summer break and cooler weather can put-off home-buying plans as the winter settles in.
Home prices and sales have tempered compared to a wild ride in 2022, shifting to a more balanced market in some (but not all) Canadian regions. This shift should give buyers more negotiating room, like being able to add conditions to purchase offers (that hopefully includes a professional home inspection to protect your buying interests).
At True North Mortgage, we know that every homebuyer's situation is different. The best thing you can do is:
- Download our free First-Time Home Buyer's Guide (even if you're buying your next home — it has great tips and advice)
- Assess your current mortgage approval status to understand what you can afford
- Know how much down payment you may need
- Understand how your debt can affect your mortgage approval
- Stay current on the market trends for your chance to jump in
Looking for a realtor? We can provide a referral based on long-standing relationships within our industry.
Are you a first-time home buyer? There are many programs and rebates to help ease your financial path to home ownership.
What can truly help your home affordability?
- Your best-possible rate
- Flexible mortgage options
- Saving-savvy experts who can help you find the right mortgage strategy in your preferred language
Unified and salaried, our highly trained brokers offer free, unbiased advice and stress-free service to potentially help you save thousands when you buy a home.
Get sound mortgage advice anywhere you are in Canada — give us a shout online, by phone, or drop by a store near you.
Be prepared to save when buying a home. Talk or apply with us today.
More info on investing in a home

First-Time Home Buyers
Get the best start and save a pile of cash with our mortgage experts.

Compare & Save Calculator
See for yourself how much you can save with our lower rates.

2026 Housing Stats
Get to know the latest Housing Market trends to inform your buying and selling decisions.

Mortgage Rate Forecast (2026-2030)
Continually updated. Where rates may go now and later — and what’s driving them.