
Alberta Mortgage Rates
Looking for the best mortgage rates in Alberta?
In Wild Rose Country, your lowest rate can save you thousands on the home you love. Apply online or call us today.
We'll beat any competitor's offer
Keep more of your money — with our lower Alberta mortgage rates.
Your best mortgage rate can save you thousands. What are you waiting for?
Apply now to get your best rate — or give us a call, drop into one of our stores, or start a chat with Morgan our chatbot.
It's free and no obligation to see what we can do for you. Our rates are lower on average compared to the competition.
Whether you're looking for a home or vacation or investment property, our highly trained True North Mortgage brokers can get your best rate possible. Plus, we can explain the ins and outs of how lenders see your application and what you can do to get an even better rate.
And, if you have more complex mortgage needs that a traditional bank can't help you with — we have the flexibility to help find a short-term mortgage solution to see you through.
A few minutes with us could save you thousands.
We'll help you get the lowest rate possible for your situation. Our friendly mortgage brokers are knowledgeable, non-commissioned and able to pass along a volume discount to get your rate even lower, sometimes with your own bank. Our volume-based approach allows us to access a wide selection of lenders and products on your behalf — to help you save the most and reach your mortgage goals sooner.
Contact us today for your best mortgage savings.
Your best rate is our obsession

Proof that our rates are lower.
Our rates are 0.18% lower on average compared to everyone else. Prove it? Okay!

Compare & Save Calculator
See for yourself how much you can save with our lower rates.

2025 Mortgage Rate Forecast
Continually updated. Are rates going down or up in 2025? Get insights from CEO Dan Eisner into…
The sooner you contact us, the sooner we can hold your rate.
Alberta mortgage interest rates are always changing — but we can hold your rates for up to 4 months (depending on the lender). Plus, we can offer you flexible mortgage solutions that fit your needs, all while providing stress-free service.
Visit an Alberta Store, get your best rate in person

Market Mall
Shopping for a great deal? A simple drop-by could save you thousands. Your mortgage is a big financial commitment — a simple stop into our Market Mall store…

Intact Place
Walk in, sit down, save a pile of cash on your mortgage. One of three downtown Calgary stores, we're located downtown between 6th and 7th Ave, on the +15…

Calgary Place
Drop by, get your best rate and better mortgage.One of three downtown Calgary stores, we're located in the 5th Avenue Place building (between 4th and 5th…

Stephen Avenue Place
Hello, come on in! Talk to a friendly broker, save thousands on your mortgage. One of three downtown stores, you can find us inside Stephen Avenue Place,…

Edmonton City Centre
Walk in, and we'll quickly find your mortgage savings. Located in downtown Edmonton, on the street level of the City Centre Mall, we're here to help you…
Alberta's most trusted Mortgage Brokers
True North Mortgage proudly started in Alberta, and we now have several locations in Calgary and Edmonton (and across Canada). At True North Mortgage, our highly trained brokers are obsessed with saving you money, and ensuring your mortgage is handled well and done on time.
With the best tech and tools, we help you in the way that's most convenient for you. Visit one of our locations, give us a call, or apply online today. We even have mobile brokers who can come to you.
Historical Mortgage Rates
For Alberta - Last Updated May 01 2025
5 Year Fixed Rate
3.99% - 5.49%
2025 (average)
4.03%
5.60%
April
3.94%
5.49%
March
3.89%
5.54%
February
4.04%
5.69%
January
4.24%
5.69%
2024 (average)
4.59%
6.31%
December
4.24%
5.69%
November
4.24%
5.69%
October
4.24%
5.69%
September
4.27%
5.77%
August
4.47%
5.79%
July
4.64%
5.79%
June
4.69%
6.89%
May
4.70%
6.89%
April
4.84%
6.89%
March
4.79%
6.89%
February
4.92%
6.89%
January
4.90%
6.89%
2023 (average)
5.03%
6.33%
December
5.12%
6.89%
November
5.44%
6.89%
October
5.62%
6.89%
September
5.47%
6.89%
August
5.37%
6.89%
July
5.19%
6.39%
June
4.92%
5.95%
May
4.57%
5.84%
April
4.84%
5.84%
March
4.66%
5.84%
February
4.67%
5.84%
January
4.54%
5.84%
2022 (average)
4.03%
4.82%
December
4.69%
5.82%
November
4.92%
5.74%
October
5.01%
5.70%
September
4.44%
5.54%
August
4.34%
5.54%
July
4.52%
5.54%
June
4.37%
5.10%
May
3.89%
4.66%
April
3.72%
4.23%
March
3.14%
3.64%
February
2.76%
3.20%
January
2.52%
3.07%
2021 (average)
1.89%
2.41%
December
2.39%
2.94%
November
2.37%
2.91%
October
2.09%
2.74%
September
1.84%
2.39%
August
1.79%
2.39%
July
1.79%
2.39%
June
1.79%
2.29%
May
1.79%
2.29%
April
1.89%
2.29%
March
1.89%
2.29%
February
1.62%
2.06%
January
1.43%
1.99%
2020 (average)
2.02%
2.43%
December
1.49%
1.99%
November
1.59%
1.99%
October
1.62%
2.04%
September
1.77%
2.05%
August
1.82%
2.22%
July
1.89%
2.39%
June
1.99%
2.42%
May
2.23%
2.65%
April
2.43%
2.88%
March
2.35%
2.68%
February
2.49%
2.86%
January
2.64%
3.01%
2019 (average)
2.76%
3.09%
December
2.55%
2.92%
November
2.40%
2.92%
October
2.52%
2.94%
September
2.45%
2.85%
August
2.47%
2.79%
July
2.57%
2.84%
June
2.66%
2.90%
May
2.82%
3.09%
April
2.92%
3.19%
March
3.13%
3.38%
February
3.32%
3.58%
January
3.30%
3.69%
2018 (average)
3.15%
3.61%
December
3.39%
3.80%
November
3.41%
3.83%
October
3.22%
3.67%
September
3.19%
3.67%
August
3.19%
3.66%
July
3.14%
3.61%
June
3.14%
3.61%
May
3.14%
3.61%
April
3.00%
3.54%
March
3.00%
3.54%
February
3.04%
3.48%
January
2.93%
3.37%
2017 (average)
2.53%
2.88%
December
2.79%
3.29%
November
2.72%
3.29%
October
2.84%
3.28%
September
2.76%
3.16%
August
2.59%
2.99%
July
2.56%
2.78%
June
2.39%
2.49%
May
2.24%
2.54%
April
2.30%
2.62%
March
2.39%
2.72%
February
2.39%
2.72%
January
2.44%
2.74%
2016 (average)
2.29%
2.58%
December
2.42%
2.69%
November
2.20%
2.47%
October
2.09%
2.39%
September
2.14%
2.49%
August
2.24%
2.57%
July
2.24%
2.57%
June
2.24%
2.57%
May
2.34%
2.59%
April
2.34%
2.59%
March
2.34%
2.69%
February
2.39%
2.69%
January
2.49%
2.69%
2015 (average)
2.45%
2.66%
December
2.47%
2.69%
November
2.47%
2.69%
October
2.33%
2.59%
September
2.39%
2.59%
August
2.39%
2.59%
July
2.39%
2.59%
June
2.44%
2.59%
May
2.44%
2.59%
April
2.44%
2.69%
March
2.49%
2.69%
February
2.54%
2.79%
January
2.59%
2.79%
2014 (average)
2.87%
3.04%
December
2.72%
2.89%
November
2.74%
2.89%
October
2.74%
2.89%
September
2.74%
2.89%
August
2.74%
2.89%
July
2.79%
2.99%
June
2.89%
3.04%
May
2.89%
3.04%
April
2.97%
3.15%
March
2.97%
3.15%
February
3.09%
3.29%
January
3.19%
3.39%
5 Year Variable Rate
4.1% - 5%
2025 (average)
4.25%
5.17%
April
4.10%
5.00%
March
4.10%
5.00%
February
4.35%
5.25%
January
4.44%
5.44%
2024 (average)
5.52%
6.75%
December
4.35%
5.50%
November
4.85%
5.95%
October
5.10%
6.20%
September
5.25%
6.45%
August
5.50%
6.70%
July
5.50%
6.70%
June
5.75%
7.05%
May
5.99%
7.30%
April
5.99%
7.30%
March
5.99%
7.30%
February
5.99%
7.30%
January
5.99%
7.30%
2023 (average)
5.77%
6.96%
December
5.99%
7.30%
November
5.99%
7.30%
October
5.99%
7.30%
September
5.99%
7.30%
August
5.99%
7.30%
July
6.00%
7.19%
June
5.75%
6.85%
May
5.50%
6.60%
April
5.50%
6.60%
March
5.50%
6.60%
February
5.50%
6.60%
January
5.50%
6.60%
2022 (average)
2.93%
3.77%
December
5.25%
6.28%
November
4.75%
5.70%
October
4.75%
5.70%
September
4.25%
4.95%
August
3.50%
4.45%
July
3.50%
4.45%
June
2.46%
3.39%
May
1.95%
2.75%
April
1.65%
2.50%
March
1.13%
1.84%
February
0.99%
1.65%
January
0.99%
1.55%
2021 (average)
1.14%
1.58%
December
0.99%
1.55%
November
0.90%
1.55%
October
1.09%
1.55%
September
1.09%
1.55%
August
1.09%
1.55%
July
1.09%
1.55%
June
1.19%
1.55%
May
1.19%
1.55%
April
1.24%
1.65%
March
1.24%
1.65%
February
1.24%
1.65%
January
1.29%
1.75%
2020 (average)
1.91%
2.24%
December
1.38%
1.79%
November
1.55%
1.80%
October
1.55%
1.90%
September
1.63%
1.88%
August
1.67%
2.00%
July
1.79%
2.03%
June
1.79%
2.03%
May
1.96%
2.23%
April
2.01%
2.41%
March
2.24%
2.64%
February
2.70%
3.10%
January
2.70%
3.10%
2019 (average)
2.70%
3.20%
December
2.70%
3.10%
November
2.70%
3.10%
October
2.70%
3.10%
September
2.70%
3.10%
August
2.70%
3.10%
July
2.70%
3.10%
June
2.70%
3.10%
May
2.70%
3.20%
April
2.75%
3.20%
March
2.75%
3.40%
February
2.70%
3.45%
January
2.65%
3.45%
2018 (average)
2.34%
2.89%
December
2.65%
3.35%
November
2.65%
3.25%
October
2.48%
3.02%
September
2.40%
2.80%
August
2.40%
2.80%
July
2.40%
2.80%
June
2.15%
2.62%
May
2.19%
2.55%
April
2.21%
2.85%
March
2.21%
2.85%
February
2.21%
2.85%
January
2.17%
2.94%
2017 (average)
1.90%
2.46%
December
1.98%
2.75%
November
1.98%
2.75%
October
2.05%
2.75%
September
2.15%
2.67%
August
1.90%
2.50%
July
1.95%
2.50%
June
1.75%
2.25%
May
1.75%
2.25%
April
1.78%
2.25%
March
1.80%
2.30%
February
1.80%
2.30%
January
1.90%
2.30%
2016 (average)
2.02%
2.30%
December
1.90%
2.30%
November
1.90%
2.30%
October
1.90%
2.30%
September
1.95%
2.30%
August
1.95%
2.30%
July
1.95%
2.30%
June
2.05%
2.30%
May
2.10%
2.30%
April
2.10%
2.30%
March
2.10%
2.30%
February
2.15%
2.30%
January
2.15%
2.30%
2015 (average)
1.97%
2.18%
December
2.10%
2.20%
November
2.02%
2.16%
October
1.90%
2.05%
September
1.90%
2.05%
August
1.85%
2.05%
July
1.92%
2.15%
June
2.05%
2.25%
May
1.98%
2.25%
April
1.98%
2.25%
March
1.98%
2.25%
February
1.98%
2.25%
January
2.00%
2.28%
2014 (average)
2.29%
2.44%
December
2.13%
2.35%
November
2.15%
2.35%
October
2.15%
2.35%
September
2.20%
2.35%
August
2.25%
2.35%
July
2.30%
2.50%
June
2.35%
2.50%
May
2.35%
2.50%
April
2.35%
2.50%
March
2.40%
2.50%
February
2.40%
2.50%
January
2.40%
2.50%
Alberta is Wild Rose Country, with a slightly wilting housing market.
Alberta's housing momentum slowed in March 2025, as home sales dipped by 9.8% since last year. As well, Q1 2025 shows a 5.5% decline in sales from Q1 2024. It should be noted, however, that Alberta has been the country's housing hotspot for well over a year, thanks in part to its higher value markets compared to more expensive markets in BC and ON.
Calgary, Central Alberta, and Medicine Hat saw the largest sales dip, down about 21%, 13% and 8%, respectively. Although Edmonton, Alberta's capital, still recorded a year-over-year decline, it surpassed Calgary's home sales for the first time. Grand Prairie, Fort McMurray and Lethbridge saw fresh activity that bucked the provincial trend, with sales gains ranging from 12% to 3%.
Despite the decrease in demand, average home prices in Alberta increased by a robust 5.9% since last March to $508,938. Most Alberta centres recorded a boost in average home prices, from 19% in Medicine Hat to 6% in Calgary.
Housing inventory grew, ranging from 32% to 7% across the province. Only Grand Prairie listings were down by -4.9%. Calgary's market (finally?) shifted to a balanced one, joining Fort McMurray. This trend brings a significant 20-point dip in AB's SNLR (sales-to-new-listing ratio) to 64%, keeping it in seller's market territory, but a sign of a wilting market in response to a slowing economy and rising AB unemployment rate.
The ongoing trade war is negatively impacting Alberta's housing market, as buyers stick to the sidelines due to financial concerns amid the economic uncertainty. Will Alberta's market show renewed blooming this Summer 2025?
Data Source: Sagen Housing Market Updates
Want more info about rates? Read on
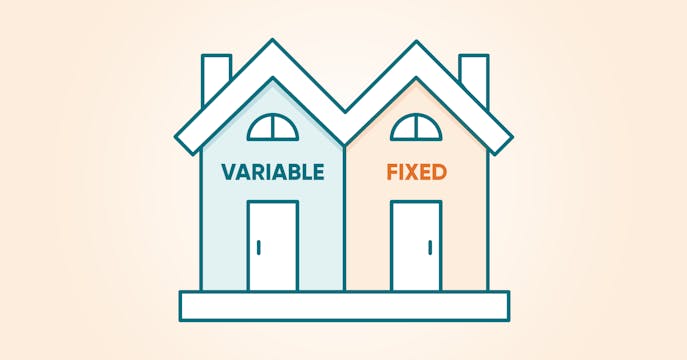
Variable vs Fixed Mortgage Rates
Which rate type works best for you, variable or fixed? Some pros and cons to help you decide.

Worried about your renewal?
Higher rates painting you into a budget corner? Get help to find a way out.

Complex Mortgages
Don't fit the mortgage mold? We may have the right fit to help you move on.
Your best rate is calling.
Alberta Mortgage Rates
Mortgage Rates are different across Canada. Rates are shown based on your location. If you're planning to purchase out-of-province, be sure to choose rates where the property will be located.
Canada Wide Mortgages
True North Mortgage can efficiently complete your mortgage anywhere you are in Canada — online, over the phone or at our store locations.
British Columbia
- Abbotsford ,
- Burnaby ,
- Chilliwack ,
- Coquitlam ,
- Courtenay ,
- Kamloops ,
- Kelowna ,
- Nanaimo ,
- New Westminster ,
- Prince George ,
- Richmond ,
- Saanich ,
- Surrey ,
- Vancouver ,
- Vernon ,
- Victoria ,
- White Rock
Alberta
- Airdrie ,
- Calgary ,
- Edmonton ,
- Fort McMurray ,
- Grande Prairie ,
- Lethbridge ,
- Lloydminster ,
- Medicine Hat ,
- Red Deer
Saskatchewan
Manitoba
Ontario
- Barrie ,
- Belleville ,
- Brampton ,
- Brantford ,
- Burlington ,
- Cornwall ,
- Guelph ,
- Hamilton ,
- Kanata ,
- Kingston ,
- Kitchener ,
- London ,
- Markham ,
- Milton ,
- Mississauga ,
- Niagara Falls ,
- North Bay ,
- Oakville ,
- Oshawa ,
- Ottawa ,
- Peterborough ,
- Sarnia ,
- Sault Ste. Marie ,
- St. Catharines ,
- Sudbury ,
- Thunder Bay ,
- Toronto ,
- Vaughan ,
- Windsor ,
- Woodstock
Quebec
Atlantic Canada
- Charlottetown ,
- Fredericton ,
- Halifax ,
- Moncton ,
- Saint John ,
- St. John's