
British Columbia Mortgage Rates
Looking for the best mortgage rates in British Columbia?
In beautiful BC, get your beautifully-lower rate and unbiased advice to save thousands. Apply or call us today.
Find a better rate? We'll beat it or give you $500
It makes sense to save more with our lower mortgage rates in BC.
A few minutes to save thousands.
In this competitive housing market, our expert, highly trained True North Mortgage brokers can help you secure your lowest rates (for which you qualify). We know the housing market landscape and can offer you discounted BC mortgage rates, even from your own bank — thanks to our strong relationships with lenders.
A better mortgage with your best rate.
With your great rate, getting the best mortgage fit also matters, whether your needs are straightforward or complex. You need flexible mortgage options that can save you cash on fees or penalties if you want to make a change, or help you pay down your mortgage faster to save thousands on interest costs (if you happen into extra funds).
Get your lower rate with less stress.
Mortgage interest rates are only part of your mortgage experience. Your best rate should come with a simple, streamlined process from your pre-approval down to signing on the (mortgage) bottom line. Our expert brokers make it easy, no matter your mortgage details.
Whether you’re a first-time buyer, or looking for an income investment property or vacation home, get pre-approved fast to know what your qualification numbers. And have peace of mind that you have a broker who's obsessed with saving you money, time and stress.
Visit us, call or apply online today!
We're obsessed with your best rate

Proof that our rates are lower.
Our rates are 0.18% lower on average compared to everyone else. Prove it? Okay!

Compare & Save Calculator
See for yourself how much you can save with our lower rates.

Mortgage Rate Forecast (2025-2027)
Continually updated. Where rates may go now and later — and what’s driving them.
Hold your rate today!
Mortgage interest rates can change quickly — contact us to hold your low current BC mortgage rates for up to 4 months (depending on the lender). If you're renewing or refinancing, it's important that you know the options that can help you save a lot more — not just take what your bank gives you.
We really know mortgages — no matter your mortgage needs, we have the expertise and free service, with no obligation, to help you save and reach your financial goals.
Come home to your best mortgage. Visit us, call or apply online today.
Great mortgage rates, in person! Visit a BC store Today

Metropolis at Metrotown
Come on down! Talk to a friendly broker for your best rate and better mortgage. You'll be glad you did. We're at the Metropolis at Metrotown mall complex…
Your best rate comes with unbeatable service.
We beat out the competition again, not just on rates but with the most 5-star reviews in the mortgage business. Your expert True North Mortgage broker cares about your experience — and offers several convenient ways to help you get pre-approved quickly, in your preferred language.
BC Mobile Mortgage Brokers
Jamie Slusarchuk
I have been a high volume mortgage broker for almost 15 years now and the best part of my job is helping people understand everything about their mortgage…
Henry Pastora
Having been in the financial and mortgage industry for over 17 years, I strive to ensure my clients receive the utmost knowledge and attention from the…
Johnson Fong
Learn MoreHistorical Mortgage Rates
For British Columbia - Last Updated Sep 02 2025
5 Year Variable Rate
4.1% - 5%
2025 (average)
4.17%
5.09%
August
4.10%
5.00%
July
4.10%
5.00%
June
4.10%
5.00%
May
4.10%
5.00%
April
4.10%
5.00%
March
4.10%
5.00%
February
4.35%
5.25%
January
4.44%
5.44%
2024 (average)
5.52%
6.75%
December
4.35%
5.50%
November
4.85%
5.95%
October
5.10%
6.20%
September
5.25%
6.45%
August
5.50%
6.70%
July
5.50%
6.70%
June
5.75%
7.05%
May
5.99%
7.30%
April
5.99%
7.30%
March
5.99%
7.30%
February
5.99%
7.30%
January
5.99%
7.30%
2023 (average)
5.77%
6.96%
December
5.99%
7.30%
November
5.99%
7.30%
October
5.99%
7.30%
September
5.99%
7.30%
August
5.99%
7.30%
July
6.00%
7.19%
June
5.75%
6.85%
May
5.50%
6.60%
April
5.50%
6.60%
March
5.50%
6.60%
February
5.50%
6.60%
January
5.50%
6.60%
2022 (average)
2.94%
3.77%
December
5.25%
6.28%
November
4.75%
5.70%
October
4.75%
5.70%
September
4.25%
4.95%
August
3.50%
4.45%
July
3.50%
4.45%
June
2.46%
3.39%
May
1.95%
2.75%
April
1.78%
2.50%
March
1.13%
1.84%
February
0.99%
1.65%
January
0.99%
1.55%
2021 (average)
1.14%
1.58%
December
0.99%
1.55%
November
0.90%
1.55%
October
1.09%
1.55%
September
1.09%
1.55%
August
1.09%
1.55%
July
1.09%
1.55%
June
1.19%
1.55%
May
1.19%
1.55%
April
1.24%
1.55%
March
1.24%
1.55%
February
1.24%
1.65%
January
1.29%
1.75%
2020 (average)
1.90%
2.25%
December
1.38%
1.79%
November
1.55%
1.80%
October
1.55%
1.90%
September
1.61%
1.87%
August
1.66%
2.00%
July
1.79%
2.10%
June
1.79%
2.10%
May
1.95%
2.25%
April
2.00%
2.43%
March
2.25%
2.50%
February
2.65%
3.10%
January
2.65%
3.10%
2019 (average)
2.68%
3.20%
December
2.65%
3.10%
November
2.65%
3.10%
October
2.65%
3.10%
September
2.65%
3.10%
August
2.65%
3.10%
July
2.65%
3.10%
June
2.68%
3.10%
May
2.70%
3.20%
April
2.75%
3.20%
March
2.75%
3.35%
February
2.70%
3.45%
January
2.65%
3.45%
2018 (average)
2.35%
2.88%
December
2.65%
3.35%
November
2.65%
3.25%
October
2.55%
2.90%
September
2.40%
2.80%
August
2.40%
2.80%
July
2.40%
2.80%
June
2.15%
2.60%
May
2.21%
2.55%
April
2.21%
2.85%
March
2.21%
2.85%
February
2.21%
2.85%
January
2.21%
3.00%
2017 (average)
1.89%
2.46%
December
1.95%
2.75%
November
1.95%
2.75%
October
2.05%
2.75%
September
2.15%
2.65%
August
1.90%
2.50%
July
1.95%
2.50%
June
1.75%
2.25%
May
1.75%
2.25%
April
1.78%
2.25%
March
1.80%
2.30%
February
1.80%
2.30%
January
1.90%
2.30%
2016 (average)
2.02%
2.30%
December
1.90%
2.30%
November
1.90%
2.30%
October
1.90%
2.30%
September
1.95%
2.30%
August
1.95%
2.30%
July
1.95%
2.30%
June
2.05%
2.30%
May
2.10%
2.30%
April
2.10%
2.30%
March
2.10%
2.30%
February
2.15%
2.30%
January
2.15%
2.30%
2015 (average)
1.98%
2.15%
December
2.10%
2.20%
November
2.05%
2.15%
October
1.90%
2.05%
September
1.90%
2.05%
August
1.85%
2.05%
July
1.90%
2.15%
June
2.05%
2.15%
May
2.00%
2.15%
April
2.00%
2.15%
March
2.00%
2.15%
February
2.00%
2.25%
January
1.95%
2.30%
2014 (average)
2.30%
2.43%
December
2.15%
2.35%
November
2.15%
2.35%
October
2.15%
2.35%
September
2.25%
2.35%
August
2.25%
2.35%
July
2.30%
2.40%
June
2.40%
2.50%
May
2.40%
2.50%
April
2.40%
2.50%
March
2.40%
2.50%
February
2.40%
2.50%
January
2.40%
2.50%
5 Year Fixed Rate
3.94% - 5.49%
2025 (average)
4.06%
5.55%
August
4.07%
5.49%
July
4.14%
5.49%
June
4.09%
5.49%
May
4.09%
5.49%
April
3.94%
5.49%
March
3.89%
5.54%
February
4.04%
5.69%
January
4.24%
5.69%
2024 (average)
4.59%
6.31%
December
4.24%
5.69%
November
4.24%
5.69%
October
4.24%
5.69%
September
4.27%
5.77%
August
4.47%
5.79%
July
4.64%
5.79%
June
4.69%
6.89%
May
4.79%
6.89%
April
4.84%
6.89%
March
4.79%
6.89%
February
4.92%
6.89%
January
4.90%
6.89%
2023 (average)
5.03%
6.33%
December
5.12%
6.89%
November
5.44%
6.89%
October
5.62%
6.89%
September
5.47%
6.89%
August
5.37%
6.89%
July
5.19%
6.39%
June
4.92%
5.95%
May
4.57%
5.84%
April
4.84%
5.84%
March
4.65%
5.84%
February
4.67%
5.84%
January
4.49%
5.84%
2022 (average)
4.03%
4.82%
December
4.69%
5.82%
November
4.92%
5.74%
October
5.01%
5.70%
September
4.44%
5.54%
August
4.34%
5.54%
July
4.52%
5.54%
June
4.37%
5.10%
May
3.89%
4.66%
April
3.72%
4.23%
March
3.14%
3.64%
February
2.74%
3.20%
January
2.52%
3.07%
2021 (average)
1.89%
2.43%
December
2.39%
2.94%
November
2.37%
2.91%
October
2.12%
2.56%
September
1.84%
2.39%
August
1.79%
2.39%
July
1.79%
2.39%
June
1.79%
2.39%
May
1.79%
2.39%
April
1.89%
2.39%
March
1.89%
2.32%
February
1.62%
1.99%
January
1.43%
1.99%
2020 (average)
2.02%
2.43%
December
1.49%
1.99%
November
1.59%
1.99%
October
1.59%
2.04%
September
1.79%
2.04%
August
1.79%
2.19%
July
1.89%
2.39%
June
1.99%
2.39%
May
2.24%
2.59%
April
2.44%
2.89%
March
2.29%
2.84%
February
2.44%
2.84%
January
2.64%
2.99%
2019 (average)
2.72%
3.09%
December
2.39%
2.89%
November
2.29%
2.94%
October
2.54%
2.94%
September
2.49%
2.84%
August
2.39%
2.79%
July
2.49%
2.84%
June
2.59%
2.84%
May
2.79%
3.09%
April
2.89%
3.19%
March
3.14%
3.39%
February
3.34%
3.59%
January
3.29%
3.72%
2018 (average)
3.15%
3.62%
December
3.39%
3.82%
November
3.49%
3.84%
October
3.19%
3.64%
September
3.19%
3.67%
August
3.19%
3.67%
July
3.14%
3.64%
June
3.14%
3.64%
May
3.14%
3.64%
April
2.99%
3.54%
March
2.99%
3.54%
February
3.09%
3.49%
January
2.89%
3.34%
2017 (average)
2.54%
2.87%
December
2.79%
3.29%
November
2.69%
3.29%
October
2.84%
3.29%
September
2.84%
3.20%
August
2.59%
2.99%
July
2.64%
2.69%
June
2.39%
2.49%
May
2.24%
2.49%
April
2.29%
2.59%
March
2.39%
2.74%
February
2.39%
2.74%
January
2.44%
2.69%
2016 (average)
2.30%
2.56%
December
2.44%
2.64%
November
2.29%
2.39%
October
2.14%
2.39%
September
2.14%
2.49%
August
2.24%
2.49%
July
2.24%
2.49%
June
2.24%
2.59%
May
2.34%
2.59%
April
2.34%
2.59%
March
2.34%
2.69%
February
2.39%
2.69%
January
2.44%
2.69%
2015 (average)
2.45%
2.65%
December
2.54%
2.69%
November
2.44%
2.69%
October
2.29%
2.59%
September
2.39%
2.59%
August
2.39%
2.59%
July
2.39%
2.59%
June
2.44%
2.59%
May
2.44%
2.59%
April
2.44%
2.69%
March
2.49%
2.69%
February
2.59%
2.69%
January
2.59%
2.79%
2014 (average)
2.88%
3.02%
December
2.74%
2.89%
November
2.74%
2.89%
October
2.74%
2.89%
September
2.74%
2.89%
August
2.74%
2.89%
July
2.79%
2.99%
June
2.94%
3.09%
May
2.94%
3.09%
April
2.94%
3.09%
March
2.94%
3.09%
February
3.09%
3.19%
January
3.19%
3.29%
Beautiful British Columbia: A desirable housing market, tougher affordability.
British Columbia’s housing market warmed up this summer, with provincial home sales up by 1.6% in July 2025, year over year.
The BC centre with the highest sales increase was Vancouver Island, up by 13.1%, followed by Kootenay, Kelowna, and Kamloops with 9.4%, 9.2% and 9.1%, respectively. Other centres with notable increases are Northern BC (5.7%) and Victoria (4.9%). On the decline side, Chilliwack experienced a sales drop of 11%, followed by Fraser Valley (-5%) and GVA (-2.4%).
BC home prices are still recovering from the market slowdown, with the average home price dropping by 2.4% year-over-year to $961,305. The decline was led by Kelowna, the GVA and Victoria, with price drops of 4%, 3.8%, and 1.1%. The rest of the BC centres showed home price growth from 10.2% to 0.2%.
New listings significantly grew in Kamloops (+13.2%) and Victoria (+2.2%), while Vancouver Island and Kootenay experienced the most pronounced slowdowns at around -6.0%. Other areas saw drops of about 5.5% to 0.9%.
BC is a balanced market provincially, with a 45% SNLR (sales-to-new-listings ratio) — a 2% rise from the same month last year. Fraser Valley remained a strong buyer’s market at 36% SNLR, while Northern BC and Kootenay were still holding court in a seller’s market, with higher SNLRs of 68% and 67%.
Housing starts across BC dipped by 15%, month over month, with Abbotsford recording a surge of 147% and Victoria increasing by 29%. However, year-to-date, housing starts have dropped for some centres, ranging from -71% in Nanaimo to -5% in Vancouver.
Home buyers remain cautious amid U.S. tariff turmoil. Yet, more are coming off the sidelines to take advantage of deals or are growing impatient, waiting to see where interest rates and the economy may be going.
Data Source: Sagen Housing Market Updates
Your best rates and advice, here's more
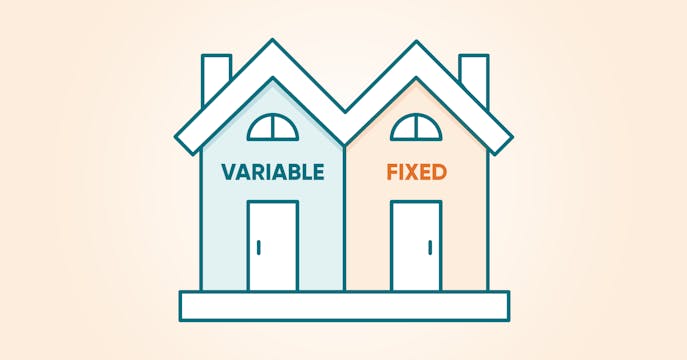
Variable vs Fixed Mortgage Rates
Which rate type works best for you, variable or fixed? Some pros and cons to help you decide.

Worried about your renewal?
Higher rates painting you into a budget corner? Get help to find a way out.

Complex Mortgages
Don't fit the mortgage mold? We may have the right solution to help you move on.
It's free and no obligation to see your best rate today.
British Columbia Mortgage Rates
Mortgage Rates are different across Canada. Rates are shown based on your location. If you're planning to purchase out-of-province, be sure to choose rates where the property will be located.
Canada Wide Mortgages
True North Mortgage can efficiently complete your mortgage anywhere you are in Canada — online, over the phone or at our store locations.
British Columbia
- Abbotsford ,
- Burnaby ,
- Chilliwack ,
- Coquitlam ,
- Courtenay ,
- Kamloops ,
- Kelowna ,
- Nanaimo ,
- New Westminster ,
- Prince George ,
- Richmond ,
- Saanich ,
- Surrey ,
- Vancouver ,
- Vernon ,
- Victoria ,
- White Rock
Alberta
- Airdrie ,
- Calgary ,
- Edmonton ,
- Fort McMurray ,
- Grande Prairie ,
- Lethbridge ,
- Lloydminster ,
- Medicine Hat ,
- Red Deer
Saskatchewan
Manitoba
Ontario
- Barrie ,
- Belleville ,
- Brampton ,
- Brantford ,
- Burlington ,
- Cornwall ,
- Guelph ,
- Hamilton ,
- Kanata ,
- Kingston ,
- Kitchener ,
- London ,
- Markham ,
- Milton ,
- Mississauga ,
- Niagara Falls ,
- North Bay ,
- Oakville ,
- Oshawa ,
- Ottawa ,
- Peterborough ,
- Sarnia ,
- Sault Ste. Marie ,
- St. Catharines ,
- Sudbury ,
- Thunder Bay ,
- Toronto ,
- Vaughan ,
- Windsor ,
- Woodstock
Quebec
Atlantic Canada
- Charlottetown ,
- Fredericton ,
- Halifax ,
- Moncton ,
- Saint John ,
- St. John's